


March 2025 Local Market Statistics
- Joshua Tree Gateway AOR
- 2 days ago
- 1 min read

Updated: 21 minutes ago
Updated 4/24/25, YTD March 2025 Market Snapshot infographics fixed from previously incorrect month's images linked.
SFR Active Listings: March 2025
Active Listings | Listings % Change LTM | Median List Price | % Active Listings w/Reduced Price | Median List Price per Sq.Ft. | Median Listed DOM | |
|---|---|---|---|---|---|---|
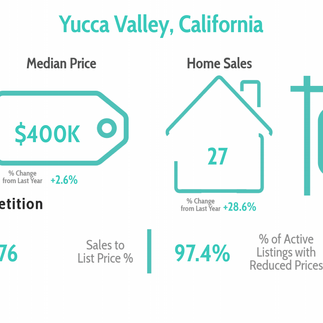
Yucca Valley | 221 | +78% | $499,999 | 40% | $293/sqft | 59 |
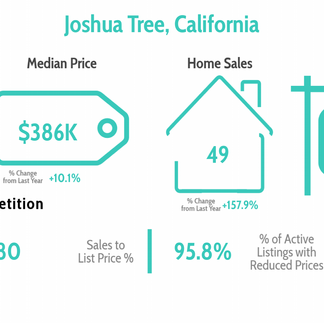
Joshua Tree | 149 | +31% | $499,900 | 40% | $399/sqft | 64 |
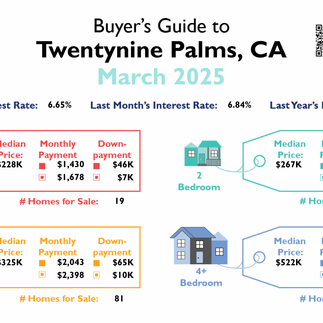
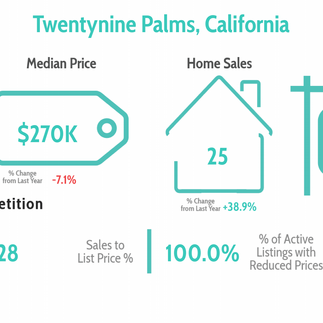
29 Palms | 174 | +51% | $317,000 | 45% | $260/sqft | 75 |
SFR Sales: March 2025
| Sales Closed | # of Sales Change % LTM | Median Sold Price | Price Growth | Median DOM at Sale | Sales Over List Price % |
|---|---|---|---|---|---|---|
Yucca Valley | 27 | +28.6% | $400,000 | +2.6% | 76 | 22% |
Joshua Tree | 18 | +125% | $380,000 | +2% | 120 | 17% |
29 Palms | 25 | +38.9% | $270,000 | -7.1% | 28 | 36% |
SFR Listings, Year to Date: as of March 2025
Average Monthly Listings | % Change in Listing Inventory | Sales to List Price % | % Active Listings Reduced | |
|---|---|---|---|---|
Yucca Valley | 208 | +77.5% | 98.6% | 39% |
Joshua Tree | 143 | +36.6% | 95.8% | 36.4% |
29 Palms | 166 | +47.9% | 100% | 41.2% |
SFR Sales, Year to Date: As of March 2025
| Sales Closed | % Change LTM | Median Sold Price | Median Price Growth | Median Days on Market at Sale | Sales Over List % |
|---|---|---|---|---|---|---|
Yucca Valley | 77 | +30.5% | $366,000 | -5% | 64 | 21% |
Joshua Tree | 49 | +157.9% | $386,000 | +10.1% | 80 | 14% |
29 Palms | 61 | +17.3% | $265,000 | -1.9% | 43 | 28% |
Downloadable Reports and Infographics
Buyer's Guides, March 2025:


Seller's Guides, March 2025:


Market Report Infographics, March 2025:


Market Report Infographics, Year To Date as of March 2025:


County and State Statistics, March 2025:
Upcoming Events at JTGAR:


Comments