
February 2025 Local Market Statistics
- Joshua Tree Gateway AOR
- Mar 18
- 1 min read

SFR Active Listings: February 2025
Active Listings | Listings % Change LTM | Median List Price | % Active Listings w/Reduced Price | Median List Price per Sq.Ft. | Median Listed DOM | |
|---|---|---|---|---|---|---|
Yucca Valley | 203 | 64% | $499,900 | 40% | 54 | |
Joshua Tree | 145 | 42% | $560,000 | 32% | $436/sqft | 57 |
29 Palms | 165 | 45% | $310,000 | 37% | $258/sqft | 66 |
SFR Sales: February 2025
| Sales Closed | # of Sales Change % LTM | Median Sold Price | Price Growth | Median DOM at Sale | Sales Over List Price % |
|---|---|---|---|---|---|---|
Yucca Valley | 29 | +21% | $330,000 | -18.4% | 56 | 17% |
Joshua Tree | 17 | +113% | $429,000 | +12.9% | 60 | 12% |
29 Palms | 20 | 0% | $256,000 | -3.6% | 82 | 20% |
SFR Listings, Year to Date: as of February 2025
Average Monthly Listings | % Change in Listing Inventory | Sales to List Price % | % Active Listings Reduced | Median DOM YTD | |
|---|---|---|---|---|---|
Yucca Valley | 201 | +77.1% | 98.8% | 38.6% | 56 |
Joshua Tree | 140 | +40% | 96% | 34.6% | 60 |
29 Palms | 162 | +46.2% | 98% | 39% | 67 |
SFR Sales, Year to Date: As of February 2025
| Sales Closed | % Change LTM | Median Sold Price | Price Growth | Sales Over List % |
|---|---|---|---|---|---|
Yucca Valley | 50 | +32% | $342,000 | -9% | 20% |
Joshua Tree | 31 | +182% | $385,500 | +17% | 13% |
29 Palms | 36 | +6% | $264,750 | +5% | 22% |
Downloadable Reports and Infographics
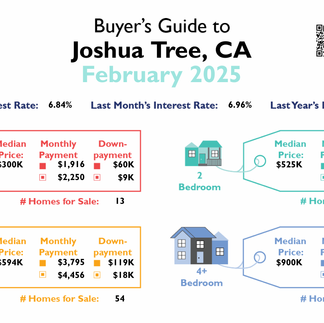
Buyer's Guides, February 2025:


Seller's Guides, February 2025:


Market Report Infographics, February 2025:


Market Report Infographics, Year To Date as of February 2025:


San Bernardino County Statistics and Inventory Reports, February 2025:


Comments